


2017 Property Sales in South BX, Vernon BC
Status: Sold (10) | ||||||
List Price | Sold Price | DOM | Beds | Total Baths | Finished Floor Area | |
Min | $434,900 | $430,000 | 15 | 3 | 2 | |
Max | $1,350,000 | $1,340,000 | 498 | 6 | 5 | 5000 |
Avg | $633,350 | $626,325 | 143 | 4 | 3 | 2147 |
Sum | $6,333,500 | $6,263,250 | ||||
Criteria:
MLS is 'OMREB'
Major Area is 'North Okanagan'
Sub-Area is 'SB - South BX'
Sold Date is 1/1/2017 to 12/31/2017
Property Type is one of 'Single Family Residential', 'Strata', 'Manufactured Home', 'Lots and Acreages', 'Recreation'
The property mix in this report contains 8 homes, and 2 land property sales.
South BX, Vernon BC Key Performance Indicator Review 2017
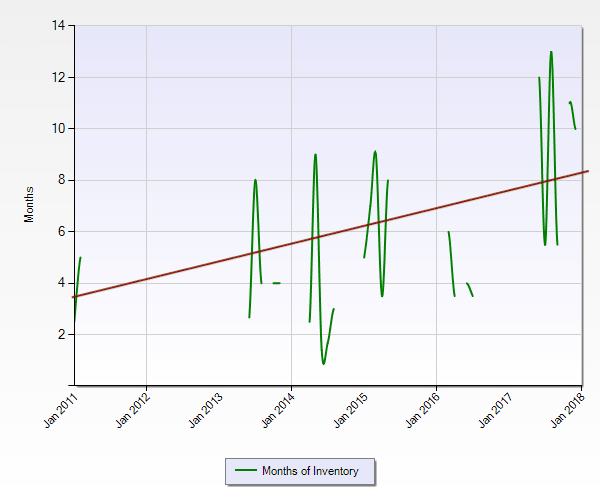
Time frame for the chart above is from Jan 2011 to January 2018 and it depicts the absorption rate of real estate specific to the South BX, Vernon BC sub area or neighbourhood with the North Okanagan zone. This area is bucking the general trend locally by having more inventory than current buyers are looking for.
Historic Look At South BX, Vernon BC Real Estate Sales Volume
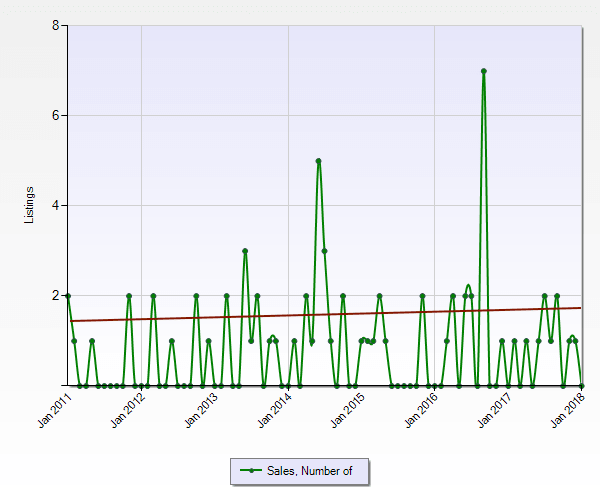
This chart reflects the MLS® property sales by month. You can see only a few months were purchases have spiked above 1 - 2 per month over the last 7 years.
Historic Trend of Active Listings
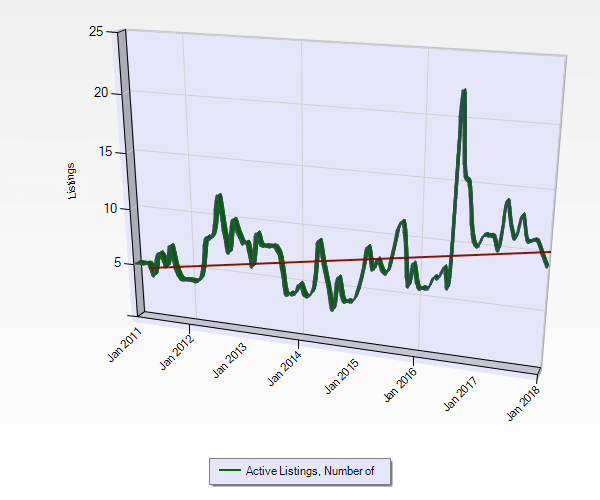
You can see that the number of properties brought to the market in recent years is trending upward. The first chart we showed you - the absorption rate - is a direct result of the increase of properties coming to market in combination with the second chart - which shows the properties SOLD. Trends like this tend to favour buyers.
Historic Median / Average Days On Market Trends for South BX, Vernon BC Residential Sales
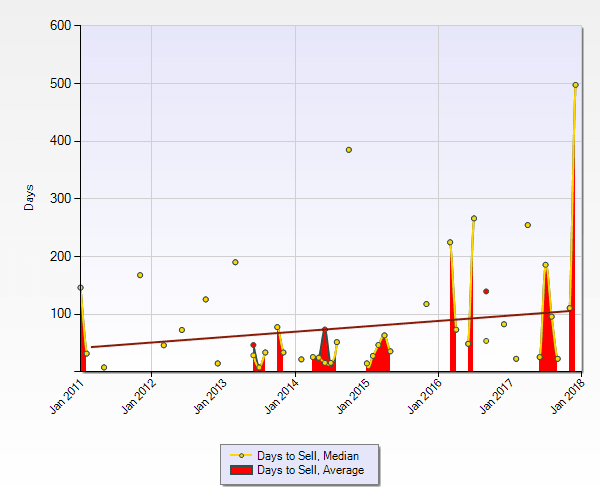
This chart shows the comparison between the average days a property was on the market. ( From Activation to Final Subject Removal) . While we can see that properties look to be to taking longer presently to sell in South BX we also know that there is not really enough data to call it a trend. Individual property analysis is required.
Historic Median Sale Price Trend for South BX, Vernon BC, Vernon BC Residential Sales
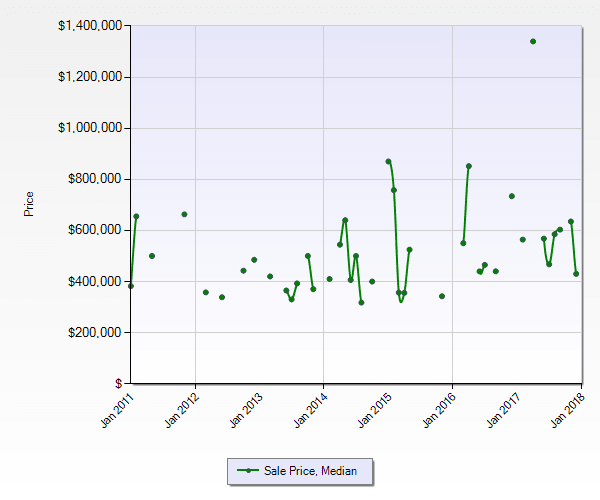
The chart above shows the upward trend of the Median (middle of the market) sale price by month over the last 7 years Again not really a clear TREND . This may be because of the property mix within the neighbourhood. We will help you look at WHAT sold to make sense of this if you just ask!
Thank you for taking the time to look at our South BX, Vernon BC , Vernon BC market synopsis. Please feel free to share it with your friends and neighbours, and especially anyone you may know that might be looking for help selling or buying in South BX, Vernon BC , Vernon BC.
Cheers!
Chris, Brent, Shelby, & Brell
REALTORS® along with the amazing
Diane, Kendra, Natalia and Yania