2017 Property Sales in Adventure Bay, Vernon BC
The chart above shows the absorption rate specific to the Adventure Bay neighbourhood. It shows the ratio of the number of months it would take to sell off the active listing inventory based on the number of sales per month. I have added the red trendline which reflects the downward trend in this neighbourhood. The most challenging time to be a seller this area was in the spring of 2012, when it would have taken over 5 years to sell all the properties on the market. Conversely, in June of 2017 - there was only 8 months supply.
Time frame is from Jan 2011 to Dec 2017
MLS is 'OMREB'
Major Area is 'North Okanagan'
Sub-Area is 'AB - Adventure Bay'
2017 Property Sales in Adventure Bay, Vernon BC
| Status: Sold (28) | |||||||
| List Price | Sold Price | DOM | Beds | Total Baths | Finished Floor Area | ||
| Min | $149,000 | $145,000 | 4 | 1 | 1 | ||
| Max | $2,389,000 | $2,150,000 | 727 | 5 | 4 | 4471 | |
| Avg | $519,278 | $496,164 | 152 | 3 | 3 | 1336 | |
| Sum | $14,539,788 | $13,892,600 | |||||
Criteria:
| MLS is 'OMREB' Major Area is 'North Okanagan' Sub-Area is 'AB - Adventure Bay' Sold Date is 1/1/2017 to 12/31/2017 Property Type is one of 'Single Family Residential', 'Strata', 'Manufactured Home', 'Lots and Acreages', 'Recreation' |
The property mix in this report contains 11 homes, 4 townhouses, and 13 land property sales.
Check out our Adventure Bay Real Estate Resources
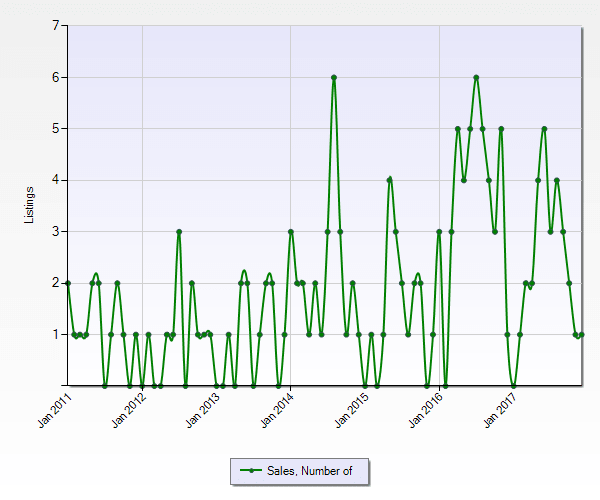
Historic Property Sales
The time frame for the chart above is from Jan 2011 to Dec 2017. You can clearly see more consistent sales activity in this area after after mid 2014.
Pricing in Adventure Bay
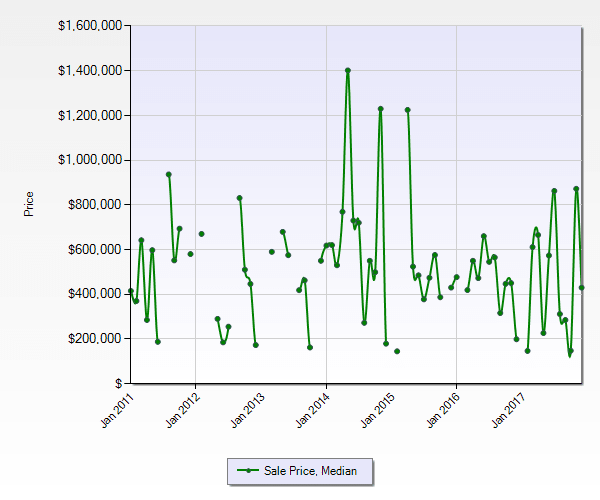
The chart above shows the median or middle of the market price results for properties sold in Adventure Bay over the last 7 years. It is not viable to look for a trendline in this analysis - as the variety of properties in this neighbourhood is too varied.
What we can surmise from this chart is the low end of the scale reflect bare land / lot sales. I see here that more sales happened for more money after 2016 than before.
Alternately the high end sales here are likely Lakeshore or high end custom lake view homes which were not in demand at all in the early portion of this graph.
To me - the most interesting part of this graph is the change in price point activity from $400,000 to $600,000 in 2015 upwards into the $600,000 to $800,000 range. These would likely be executive style single family homes, with the price edging upward with construction sales.
The sales around the $400,000 mark will also reflect the few townhome options in Peregrine Estates.
.png)
.png)

