.png)
.png)


2017 Property Sales in North BX
Status: Sold (83) | ||||||
List Price | Sold Price | DOM | Beds | Total Baths | Finished Floor Area | |
Min | $39,900 | $35,000 | 2 | 2 | 1 | |
Max | $7,900,000 | $7,500,000 | 544 | 7 | 8 | 12753 |
Avg | $636,111 | $620,691 | 76 | 4 | 3 | 2210 |
Sum | $52,797,233 | $51,517,368 | ||||
Criteria:
MLS is 'OMREB'
Major Area is 'North Okanagan'
Sub-Area is 'NB - North BX'
Sold Date is 1/1/2016 to 12/31/2016
Property Type is one of 'Lots and Acreages', 'Manufactured Home', 'Recreation', 'Single Family Residential', 'Strata'
The property mix in this report contains 68 homes, 1 manufactured home, and 14 land property sales.
North BX Key Performance Indicator Review 2017
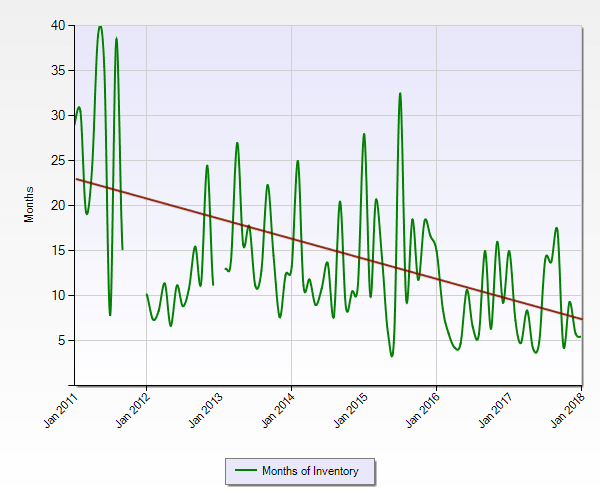
Time frame for the chart above is from Jan 2011 to January 2018 and it depicts the absorption rate of real estate specific to the North BX sub area or neighbourhood with the North Okanagan zone.
From 2011 to mid 2015 sellers often faced absorptions rate of more than 15 months based on the number of properties on the market compared to the number of sales. Fast forward to 2017 where much of the year there was less than 10 months.
Historic Look At North BX Real Estate Sales Volume
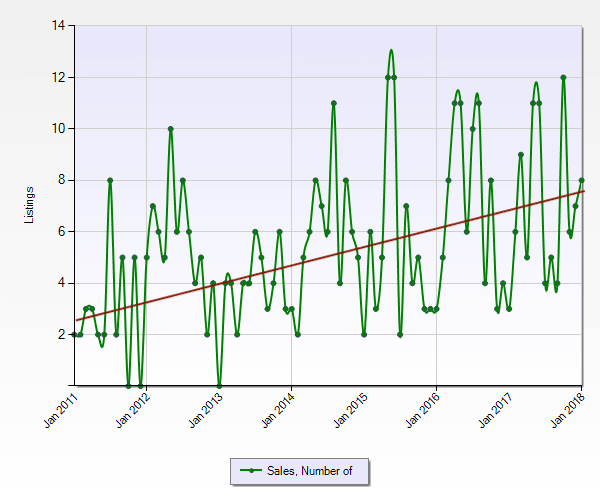
This chart reflects the MLS® property sales by month. The trend line shows clearly that sales volume has climbed steadily - although the jagged variation shows the seasonal nature of Okanagan real estate sales activity, with less sales in the winter months.
Historic Trend of Active Listings
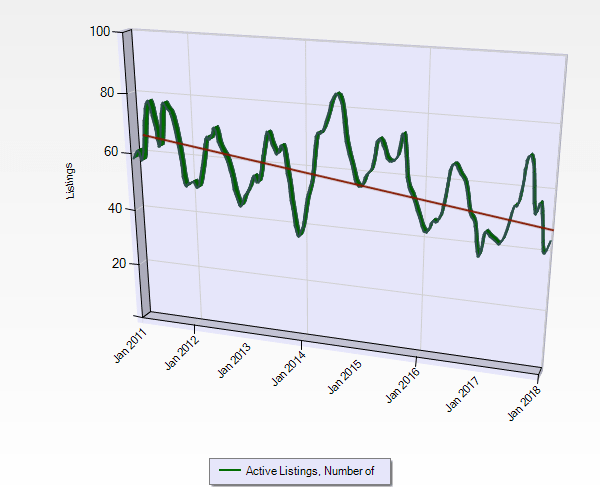
You can see that the number of properties brought to the market in recent years is trending downward. The first chart we showed you - the absorption rate - is a direct result of the reduction of properties coming to market in combination with the second chart - which shows the increase in properties SOLD. Trends like this tend to favour sellers.
Historic Median / Average Days On Market Trends for North BX Residential Sales
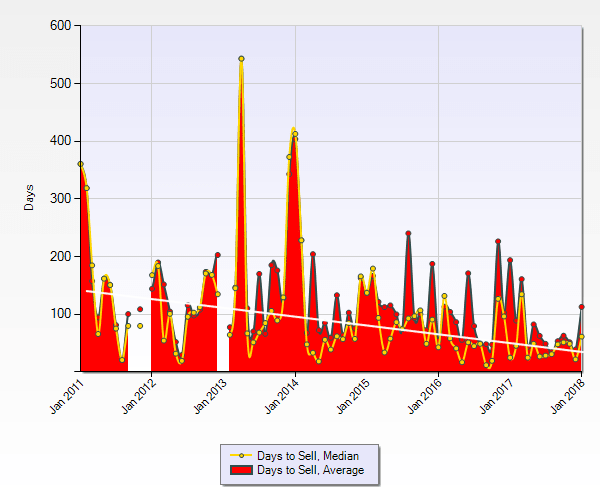
This chart shows the comparison between the average days a property was on the market. ( From Activation to Final Subject Removal) . North BX , properties prior to early 2015 generally needed more time on the market than in some other neighbourhoods to get sold. However, right priced properties in North BX in 2017 sold very quickly with less than 60 days on market.
Historic Median Sale Price Trend for North BX , Vernon BC Residential Sales
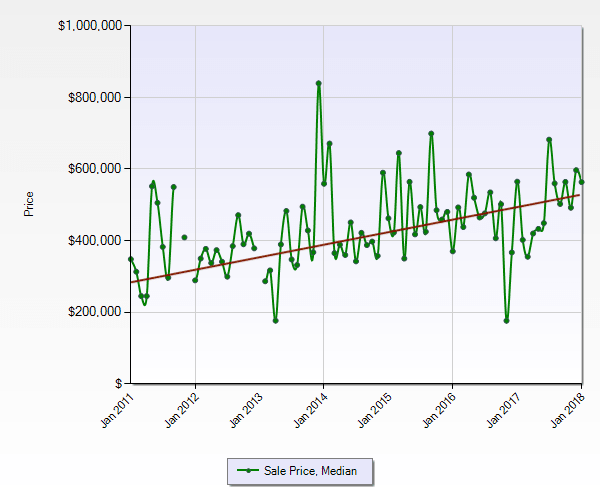
The chart above shows the upward trend of the Median (middle of the market) sale price by month over the last 7 years. It shows the steady upward trend and indicates the middle of the market has risen approximately $200,000 in North BX.
Thank you for taking the time to look at our North BX , Vernon BC market synopsis. Please feel free to share it with your friends and neighbours, and especially anyone you may know that might be looking for help selling or buying in North BX , Vernon BC.
Cheers!
Chris, Brent, Shelby, & Brell
REALTORS® along with the amazing
Diane, Kendra, Natalia and Yania