.png)
.png)


2017 Property Sales in Predator Ridge,Vernon BC
Predator Ridge is defined as all properties within the Predator Ridge development area.
2017 Property Sales in Predator Ridge, Vernon BC
Status: Sold (53) | ||||||
List Price | Sold Price | DOM | Beds | Total Baths | Finished Floor Area | |
Min | $65,000 | $55,000 | 3 | 1 | ||
Max | $1,299,000 | $1,262,000 | 1035 | 4 | 4 | 3493 |
Avg | $523,564 | $509,727 | 113 | 3 | 3 | 1727 |
Sum | $27,748,900 | $27,015,543 | ||||
Criteria:
MLS is 'OMREB'
Major Area is 'North Okanagan'
Sub-Area is 'PR - Predator Ridge'
Sold Date is 1/1/2017 to 12/31/2017
Property Type is one of 'Single Family Residential', 'Strata', 'Manufactured Home', 'Lots and Acreages', 'Recreation'
The property mix in this report contains 25 homes, 6 apartments, 8 townhouses, 5 land property sales, and 9 recreation properties.
Land Sales may include: lot or acreage. While Home sales may include duplex units (half or full), four plex units, single family homes with carriage homes, single family homes on acreage, single family homes within a bare land strata, home, timeshare, or triplex units. Townhouse sales may include detached or semi detached units.
Predator Ridge Key Performance Indicator Review 2017
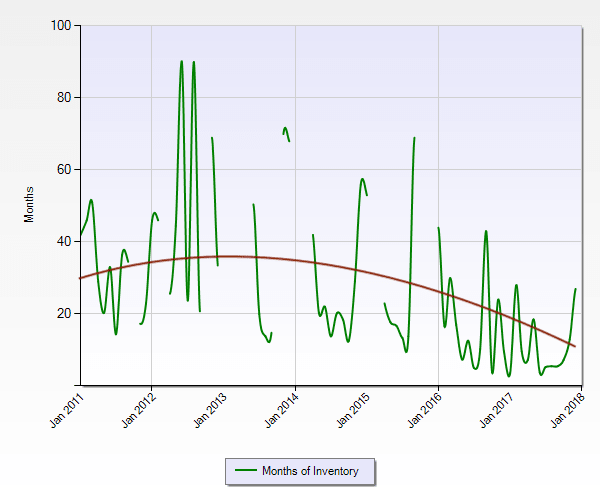
Time frame for the chart above is from Jan 2011 to January 2018 and it depicts the absorption rate of real estate specific to the Predator Ridge sub area or neighbourhood with the North Okanagan zone.
From 2011 through 2016 sellers often faced absorptions rate of more than 20 months based on the number of properties on the market compared to the number of sales. Fast forward to 2017 where it was common to have less than 1 year of inventory.
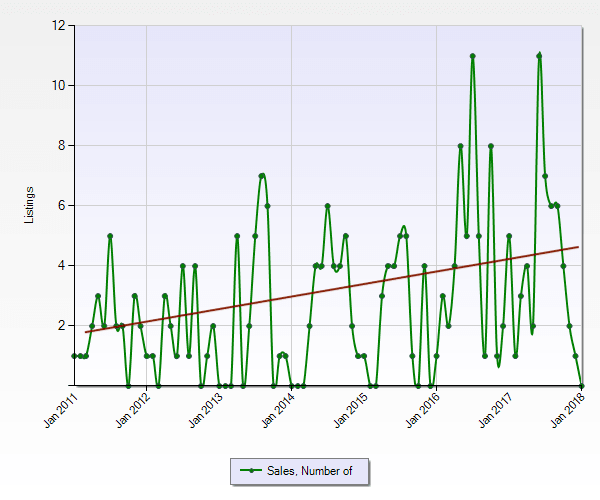
Historic Look At Predator Ridge Real Estate Sales Volume
Historic Trend of Active Listings
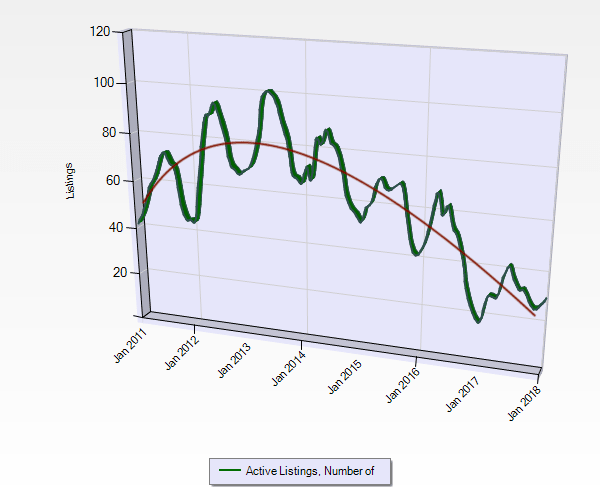
You can see that the number of properties brought to the market in recent years is trending downward. The first chart we showed you - the absorption rate - is a direct result of the reduction of properties coming to market in combination with the second chart - which shows the increase in properties SOLD. Trends like this tend to favour sellers.
Historic Median / Average Days On Market Trends for Predator Ridge Residential Sales
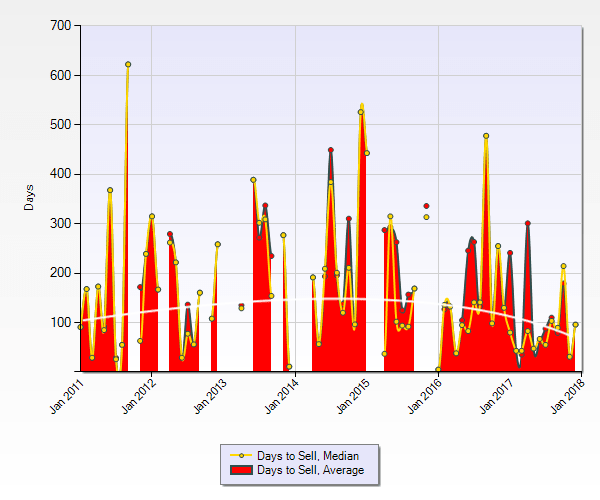
This chart shows the comparison between the average days a property was on the market. ( From Activation to Final Subject Removal) . Predator Ridge , properties prior to early 2015 generally needed more time on the market than in some other neighbourhoods to get sold. However, right priced properties in Predator Ridge in 2017 sold very quickly with less than 100 days on market.
Historic Median Sale Price Trend for Predator Ridge, Vernon BC Residential Sales
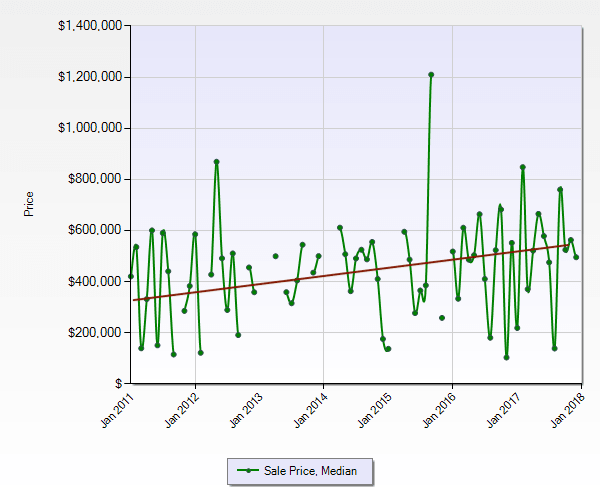
The chart above shows the upward trend of the Median (middle of the market) sale price by month over the last 7 years.You can see the upward trend of prices. The median is moderated by the mix of home types available, but also buoyed by new construction values here.
Thank you for taking the time to look at our Predator Ridge , Vernon BC market synopsis. Please feel free to share it with your friends and neighbours, and especially anyone you may know that might be looking for help selling or buying in Predator Ridge, Vernon BC.
Cheers!
Chris, Brent, Shelby, & Brell
REALTORS® along with the amazing
Diane, Kendra, Natalia and Yania