.png)
.png)


2017 Property Sales in Westmount, Vernon BC
2017 Property Sales in Westmount, Vernon BC
Land Sales may include: lot, waterfront lot, acreage and waterfront acreage. While Home sales may include duplex units (half or full), four plex units, single family homes with carriage homes, single family homes on acreage, single family homes within a bare land strata, home, timeshare, or triplex units. Townhouse sales may include detached or semi detached units.
Status: Sold (36) | ||||||
List Price | Sold Price | DOM | Beds | Total Baths | Finished Floor Area | |
Min | $139,000 | $125,000 | 7 | 2 | 1 | |
Max | $699,000 | $648,500 | 146 | 6 | 5 | 3752 |
Avg | $377,206 | $370,722 | 37 | 3 | 3 | 1889 |
Sum | $13,579,400 | $13,346,000 | ||||
Criteria:
MLS is 'OMREB'
Major Area is 'North Okanagan'
Sub-Area is 'WM - Westmount'
Sold Date is 1/1/2017 to 12/31/2017
Property Type is one of 'Single Family Residential', 'Strata', 'Manufactured Home', 'Lots and Acreages', 'Recreation'
The property mix in this report contains 21 homes, 1 apartment, 12 townhouses, and 2 land property sales.
Westmount, Vernon BC Key Performance Indicator Review 2017
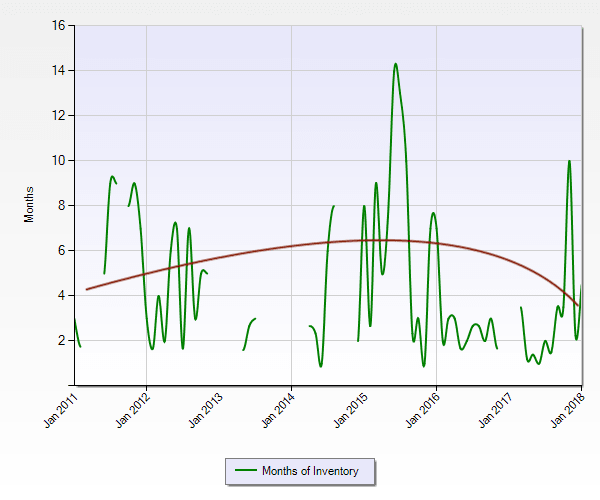
Time frame for the chart above is from Jan 2011 to January 2018 and it depicts the absorption rate of real estate specific to the Westmount, Vernon BC sub area or neighbourhood with the North Okanagan zone. You can see the current trend of less inventors starting in 2015.
Historic Look At Westmount, Vernon BC Real Estate Sales Volume
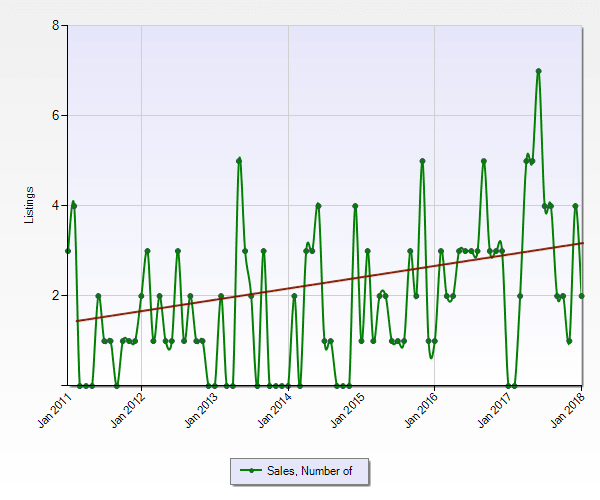
This chart reflects the MLS® property sales by month. You can see the number of sales rising consistently along with the seasonal variations - less sales in winter. Significantly more sales in 2017 than in 2011 - 2013.
Historic Trend of Active Listings
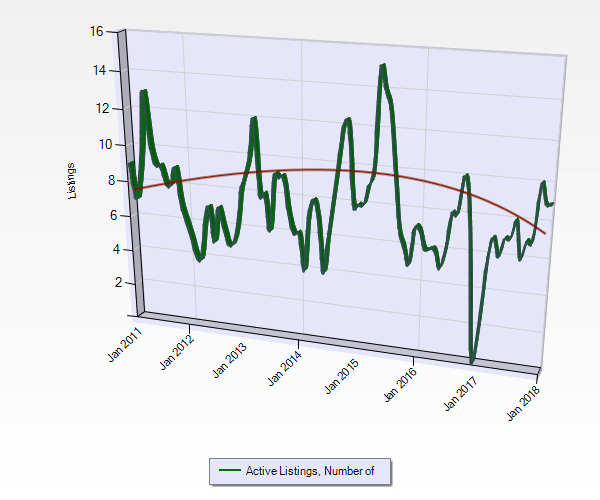
You can see that the number of properties brought to the market in recent years is trending upward. The first chart we showed you - the absorption rate - is a direct result of the increase of properties coming to market in combination with the second chart - which shows the properties SOLD. Overall in Westmount the trend is flat with 7 -8 properties on the market most of the time.
Historic Median / Average Days On Market Trends for Westmount, Vernon BC Residential Sales
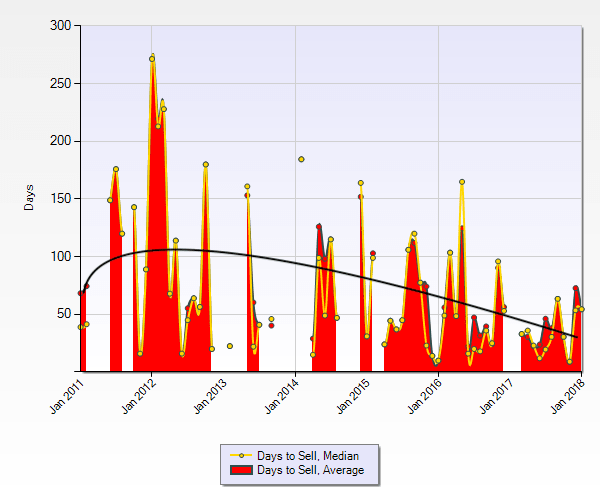
This chart shows the comparison between the average days a property was on the market. ( From Activation to Final Subject Removal) in Westmount. You can see that the days to sell are trending downward since early 2012. Many times in 2017 the average days to sell was less than 60.
Historic Median Sale Price Trend for Westmount, Vernon BC, Vernon BC Residential Sales
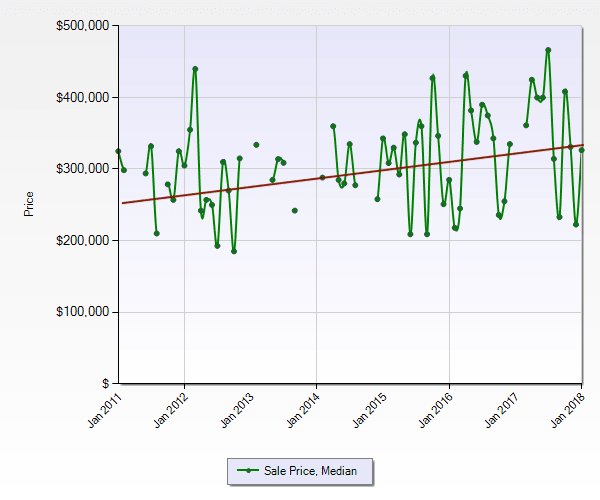
The chart above shows the upward trend of the Median (middle of the market) sale price by month over the last 7 years. You can see the upward trend of sale prices. in this neighbourhood. We will help you look at WHAT sold to make sense of this if you just ask!
Thank you for taking the time to look at our Westmount, Vernon BC market synopsis. Please feel free to share it with your friends and neighbours, and especially anyone you may know that might be looking for help selling or buying in Westmount, Vernon BC.
Cheers!
Chris, Brent, Shelby, & Brell
REALTORS® along with the amazing
Diane, Kendra, Natalia and Yania