.png)
.png)


Central Okanagan Real Estate Report March 2018
Based on March 1st - 31st
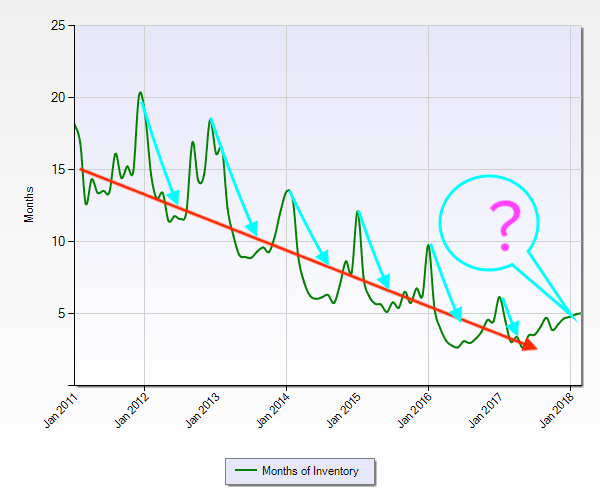
This month we've added a new feature - a look at our favourite key performance indicator - the "Absorption Rate." displayed below as "Months of Inventory" - the time it would take to sell out all active listings based on the demand at the time.
Condo/Apartments
| Sales | 129 |
| New Listings | 279 |
| Current Inventory | 416 |
| Number of Months | 3 |
| Sell/Inv. Ratio | 31.01% |
| Days to Sell | 42 |
| Days – Range | 6 to 356 |
| Average Price | $364,062 |
| Median Price | $330,000 |
| Price - Range | $89,000 - $1,035,000 |
| Hottest Neighbourhood | Kelowna North |
Condo/Townhouses
| Sales | 63 |
| New Listings | 145 |
| Current Inventory | 244 |
| Number of Months | 4 |
| Sell/Inv. Ratio | 25.82% |
| Days to Sell | 46 |
| Days – Range | 9 to 287 |
| Average Price | $499,413 |
| Median Price | $466,571 |
| Price - Range | $242,000 - $1,055,000 |
| Hottest Neighbourhood | Springfield/Spall |
Lots & Acreages
| Sales | 13 |
| New Listings | 75 |
| Current Inventory | 333 |
| Number of Months | 26 |
| Sell/Inv. Ratio | 3.90% |
| Days to Sell | 156 |
| Days – Range | 11 to 343 |
| Average Price | $322,157 |
| Median Price | $264,900 |
| Price - Range | $78,500 - $770,000 |
| Hottest Neighbourhood | Black Mountain |
Residential Homes
| Sales | 183 |
| New Listings | 420 |
| Current Inventory | 801 |
| Number of Months | 4 |
| Sell/Inv. Ratio | 22.85% |
| Days to Sell | 53 |
| Days – Range | 3 to 443 |
| Average Price | $734,197 |
| Median Price | $685,000 |
| Price - Range | $248,000 - $3,600,000 |
| Hottest Neighbourhood | Kelowna South |
Ratio of Sales vs Inventory 22.38%