Central Okanagan Residential Real Estate Statistics September, 2017
September 2017 Central Okanagan Real Estate Market Report
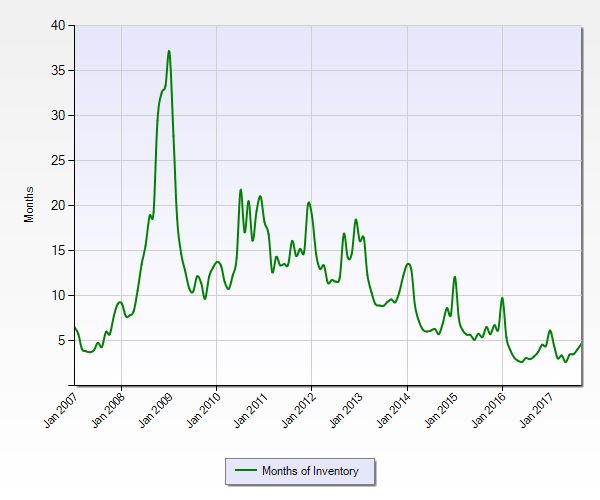
One of the most important key performance indicators in the local real estate market is the Absorption Rate. This is a measure of how many months it would take to sell off all of the currently listed properties at the last month's number of sales.
Central Zone (Peachland to Lake Country):
As you can see - we are presently in a similar position to mid 2007 with less than 5 months of property inventory on hand. This chart shows that the downward trend which started in 2011 continues. It also clearly shows the cyclical, seasonal nature of our market.
Currently we have 4.74 months of inventory on hand, but over the course of the last 10 years, there has been as high as 37.09 months in January of 2009 and as few as 2.66 months - in May of this year!
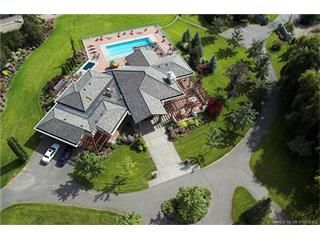
Top Sale for September in Central Okanagan:
|
| |||||||||||||||||||||||||||||
Marketed as:
| |||||||
The following charts are based on September 1st - 30th, 2017
Here is our look at the OMREB numbers in Central Okanagan MLS® real estate.
Monthly Sales statistics are based on the sales reported by real estate offices on or before the last day of the month.
| Condo Apartment | |
| Listings Sold | 127 |
| New Listings | 180 |
| Current Inventory | 354 |
| Absorption Rate Sell/List | 35.88% |
| Months of Inventory on Hand | 3 Months |
| Days to Sell (Average) | 58 |
| Days to Sell (Range) | 2 to 742 |
| Average Sale Price | $323,493 |
| Median Sale Price | $300,000 |
| Range of Sales Prices | $119,400 - $860,000 |
| Hottest Neighbourhood | Lower Mission |
| Condo Townhouse | |
| Listings Sold | 70 |
| New Listings | 104 |
| Current Inventory | 242 |
| Absorption Rate Sell/List | 31.40% |
| Months of Inventory on Hand | 3 Months |
| Days to Sell (Average) | 49 |
| Days to Sell (Range) | 3 to 190 |
| Average Sale Price | $468,617 |
| Median Sale Price | $455,000 |
| Range of Sales Prices | $187,000 - $899,473 |
| Hottest Neighbourhood | Westbank Centre |
| Building Lot | |
| Listings Sold | 41 |
| New Listings | 82 |
| Current Inventory | 350 |
| Absorption Rate Sell/List | 11.71% |
| Months of Inventory on Hand | 9 Months |
| Days to Sell (Average) | 114 |
| Days to Sell (Range) | 2 to 622 |
| Average Sale Price | $438,800 |
| Median Sale Price | $252,500 |
| Range of Sales Prices | $49,000 - $3,700,000 |
| Hottest Neighbourhood | Lake Country South West |
| Residential Homes | |
| Listings Sold | 193 |
| New Listings | 386 |
| Current Inventory | 961 |
| Absorption Rate Sell/List | 20.08% |
| Months of Inventory on Hand | 5 Months |
| Days to Sell (Average) | 49 |
| Days to Sell (Range) | 5 to 349 |
| Average Sale Price | $710,578 |
| Median Sale Price | $625,000 |
| Range of Sales Prices | $222,500 - $7,000,000 |
| Hottest Neighbourhood | Lakeview Heights |
Ratio of Sales vs Inventory 27.82%
Totals include variables in any given due to previous month’s collapsed sales and deleted listings. e & eo
.png)
.png)


