North Okanagan Real Estate Report March , 2018
Based MLS® sales reported by REALTORS® on March 1st - 31st
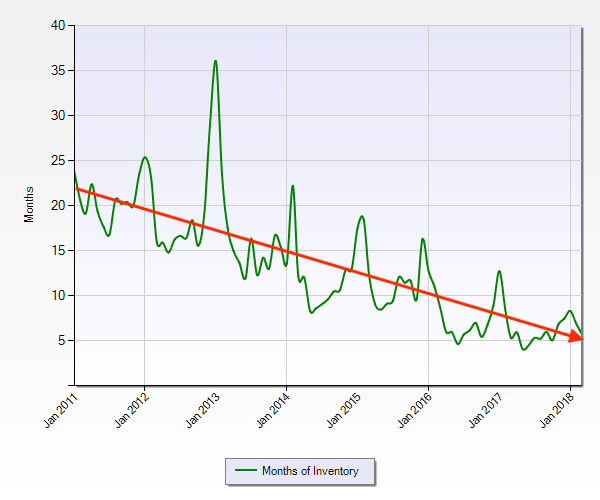
New this month - we are adding our favourite key performance indicator - the Absorption Rate - displayed below as "Months of Inventory" - the time it would take to sell out all active listings, based on the demand at the time.
At the end of March there was almost 6 months of supply - which indicates some balance in in the market, as opposed to the market favouring buyers in the first 6 years of this chart.
Criteria:
Time frame is from Jan 2011 to Mar 2018, MLS is 'OMREB', Major Area is 'North Okanagan' - All property types.
Condo/Apartments
| Sales | 25 |
| New Listings | 40 |
| Current Inventory | 73 |
| Number of Months | 3 |
| Sell/Inv. Ratio | 34.25% |
| Days to Sell | 108 |
| Days – Range | 1 to 939 |
| Average Price | $221,455 |
| Median Price | $201,000 |
| Price - Range | $102,000 - $403,400 |
| Hottest Neighbourhood | Vernon City |
Condo/Townhouses
| Sales | 23 |
| New Listings | 53 |
| Current Inventory | 93 |
| Number of Months | 4 |
| Sell/Inv. Ratio | 24.73% |
| Days to Sell | 61 |
| Days – Range | 10 to 197 |
| Average Price | $309,852 |
| Median Price | $305,000 |
| Price - Range | $156,000 - $583,700 |
| Hottest Neighbourhood | Okanagan Landing |
Lots & Acreages
| Sales | 14 |
| New Listings | 37 |
| Current Inventory | 296 |
| Number of Months | 21 |
| Sell/Inv. Ratio | 4.73% |
| Days to Sell | 214 |
| Days – Range | 19 to 477 |
| Average Price | $161,464 |
| Median Price | $166,250 |
| Price - Range | $50,000 - $300,000 |
| Hottest Neighbourhood | North Okanagan |
Residential Homes
| Sales | 71 |
| New Listings | 145 |
| Current Inventory | 290 |
| Number of Months | 4 |
| Sell/Inv. Ratio | 24.48% |
| Days to Sell | 53 |
| Days – Range | 2 to 335 |
| Average Price | $478,874 |
| Median Price | $442,500 |
| Price - Range | $178,000 - $1,500,000 |
| Hottest Neighbourhood | Armstrong/Spall |
Ratio of Sales vs Inventory 21.52%
.png)
.png)
