Shuswap Residential Real Estate Report March, 2018
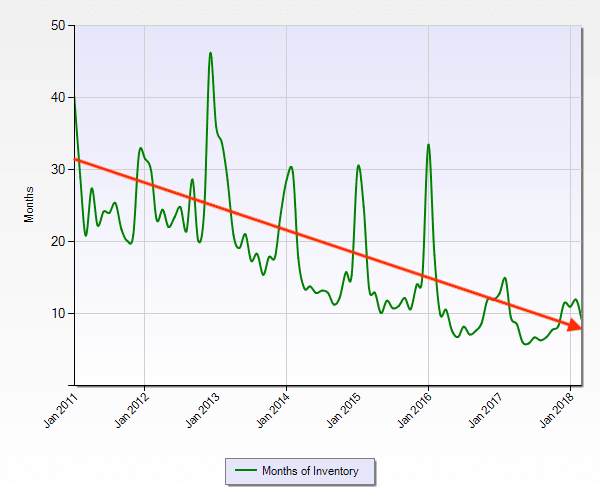
This month we've added a new feature - a look at our favourite key performance indicator - the "Absorption Rate." displayed below as "Months of Inventory" - the time it would take to sell out all active listings based on the demand at the time.

Condo/Apartments
| Sales | 6 |
| New Listings | 11 |
| Current Inventory | 36 |
| Number of Months | 6 |
| Sell/Inv. Ratio | 16.67% |
| Days to Sell | 111 |
| Days – Range | 19 to 301 |
| Average Price | $265,717 |
| Median Price | $226,400 |
| Price - Range | $188,000 - $515,000 |
| Hottest Neighbourhood | South East Salmon Arm |
Condo/Townhouses
| Sales | 6 |
| New Listings | 19 |
| Current Inventory | 44 |
| Number of Months | 7 |
| Sell/Inv. Ratio | 11.36% |
| Days to Sell | 80 |
| Days – Range | 17 to 215 |
| Average Price | $340,200 |
| Median Price | $330,000 |
| Price - Range | $250,000 - $425,000 |
| Hottest Neighbourhood | North Shuswap |
Lots & Acreages
| Sales | 16 |
| New Listings | 41 |
| Current Inventory | 273 |
| Number of Months | 17 |
| Sell/Inv. Ratio | 5.86% |
| Days to Sell | 356 |
| Days – Range | 11 to 2,032 |
| Average Price | $105,527 |
| Median Price | $121,000 |
| Price - Range | $19,900 - $210,000 |
| Hottest Neighbourhood | North Shuswap |
Residential Homes
| Sales | 34 |
| New Listings | 76 |
| Current Inventory | 196 |
| Number of Months | 6 |
| Sell/Inv. Ratio | 17.35% |
| Days to Sell | 99 |
| Days – Range | 8 to 459 |
| Average Price | $539,705 |
| Median Price | $421,475 |
| Price - Range | $168,889 - $1,415,000 |
| Hottest Neighbourhood | South East Salmon Arm |
Ratio of Sales vs Inventory 13.77%
.png)
.png)