.png)
.png)


Vernon BC Home Sales 2018 - First Quarter
First Quarter 2018 is history -and here is a comparative recap based on Single Family Home Sales in VERNON, BC.
We have filtered out Duplex, triplex and fourplex units as well as homes on acreage. This information is based on data that type of dwelling is one of :
- Single Family w/ Carriage House,
- Single Family - Bare Land Strata,
- Single Family
and
MLS is 'OMREB', Major Area is 'North Okanagan', City is 'Vernon'
Number of Home Sales Each Month
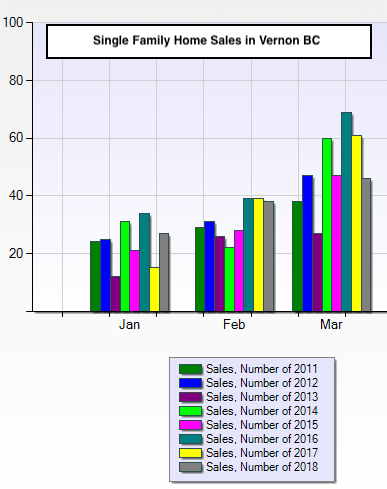
| Month | Sales 2011 | Sales 2012 | Sales 2013 | Sales 2014 | Sales 2015 | Sales 2016 | Sales 2017 | Sales 2018 |
| Jan | 24 | 25 | 12 | 31 | 21 | 34 | 15 | 27 |
| Feb | 29 | 31 | 26 | 22 | 28 | 39 | 39 | 38 |
| Mar | 38 | 47 | 27 | 60 | 47 | 69 | 61 | 46 |
Number of Active Vernon Home Listings Each Month
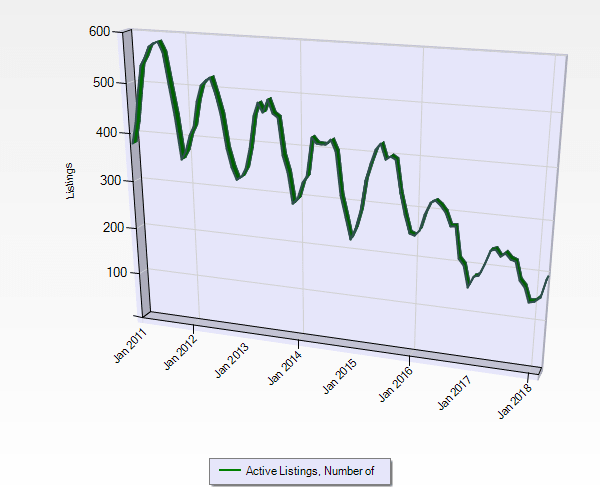
| Month | 2011 | 2012 | 2013 | 2014 | 2015 | 2016 | 2017 | 2018 |
| Jan | 366 | 364 | 329 | 295 | 247 | 248 | 180 | 145 |
| Feb | 409 | 397 | 344 | 328 | 284 | 260 | 183 | 154 |
| Mar | 463 | 417 | 384 | 339 | 344 | 294 | 206 | 191 |
Median or Middle of the Market Price Trend
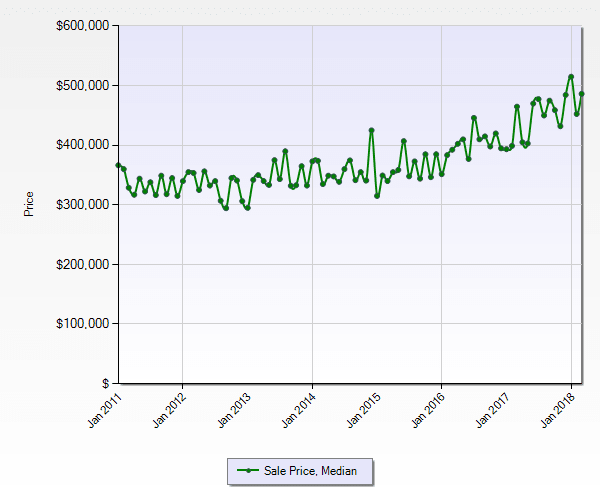
In 2011, the middle of the market sat at about $320,000 for a home in Vernon. Fast forward to 2018 and add $164,617. as we see the middle of the market
Month | 2015 | 2016 | 2017 | 2018 |
Jan | $315,000 | $351,500 | $393,500 | $515,000 |
Feb | $349,334 | $383,500 | $399,000 | $452,500 |
Mar | $340,000 | $392,500 | $464,900 | $486,350 |
Analytically - we can see that prices started to truly rise in 2015 for homes in Vernon, BC.
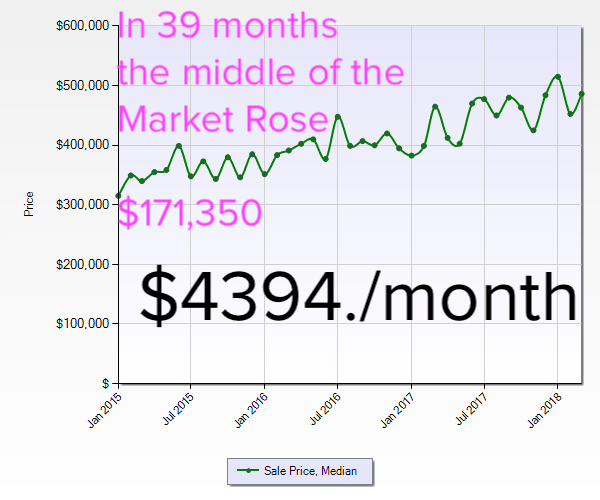
This pressure adds to buyer stress, in a market where inventory is low, and the competition fierce.