.png)
.png)


North Okanagan Real Estate Report for June 2019
June Market Report
North Okanagan – Monthly Statistics
Based on transactions reported to OMREB June 1st – 30th 2019.
With 1,626 active listings to choose from at the end of June, buyers had almost 5% more properties to choose from.
Condo/Apartments
Sales | 10 |
New Listings | 29 |
Current Inventory | 76 |
Number of Months | 8 |
Sell/Inv. Ratio | 13.16% |
Days to Sell | 51 |
Days – Range | 13 to 190 |
Average Price | $181,375 |
Median Price | $150,625 |
Price - Range | $122,400 - $325,000 |
Hottest Neighbourhood | City of Vernon |
Condo/Townhouses
Sales | 29 |
New Listings | 42 |
Current Inventory | 164 |
Number of Months | 5.65 |
Sell/Inv. Ratio | 17.68% |
Days to Sell | 72 |
Days – Range | 6 to 402 |
Average Price | $367,741 |
Median Price | $375,000 |
Price - Range | $194,500 - $734,000 |
Hottest Neighbourhood | Okanagan Landing |
Lots & Acreages
Sales | 11 |
New Listings | 41 |
Current Inventory | 320 |
Number of Months | 29 |
Sell/Inv. Ratio | 3.44% |
Days to Sell | 87 |
Days – Range | 6 to 362 |
Average Price | $212,891 |
Median Price | $265,000 |
Price - Range | $45,500 - $375,000 |
Hottest Neighbourhood | North BX |
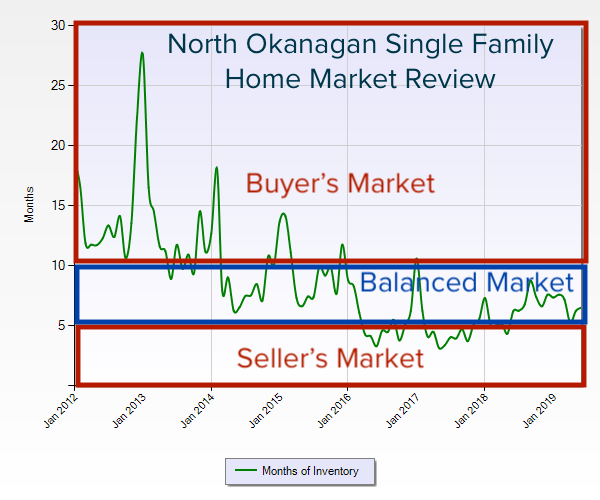
Residential Family Homes
Sales | 109 |
New Listings | 181 |
Current Inventory | 534 |
Number of Months | 5 |
Sell/Inv. Ratio | 20.41% |
Days to Sell | 54 |
Days – Range | 3 to 351 |
Average Price | $501,156 |
Median Price | $464,900 |
Price - Range | $203,500 - $1,400,000 |
Hottest Neighbourhood | Armstrong/Spall |
Ratio of Sales vs Inventory 18.21%
PLEASE NOTE: Average prices indicate market trending only. They do not reflect actual prices which vary from house to house and area to area. The Median sale price is the midpoint of sales during the month. The Average and Median Sold Prices are for Single Family Homes and do not include Residential Waterfront Properties.